I enjoy programming and creating great applications for users to electronically track and store their data, but the users will invariably want me to create reports for them from the data which we collect, and I do not enjoy this at all. It is tedious work, and it is never ending. There are always new ways to calculate or format the data which result in request to change the existing reports or add new reports. This is just not a good use of my time. So, I frequently try to expose the data to the users so that they can access it using Excel and create their own reports from there.
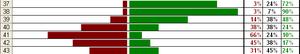
In one particular case I wanted to have an inline bar graph to visually show how each of the rows in an Excel spreadsheet related to the other rows. What I was looking for was a sideways candlestick chart of sorts. After some searching I found a solution built into Excel. It is possible to use the REPT function to repeat a character a specified number of times. My favorite solutions are the simple ones, and this is about as simple as it gets, here is an example: =REPT(“█”,L8) The image shows an example of the results.