Let’s intelligently connect many pieces of legacy infrastructure to the internet, and do it in such a way that insights can be gleaned from the all data it generates. The premise sounds simple enough, but in practice such a project requires deep knowledge of a wide range of technologies. However, by breaking the problem down into discrete, logical pieces, we can prove that a working solution is possible in a relatively short period of time. We did this exact thing for a recent project, and this is the overall approach we took.
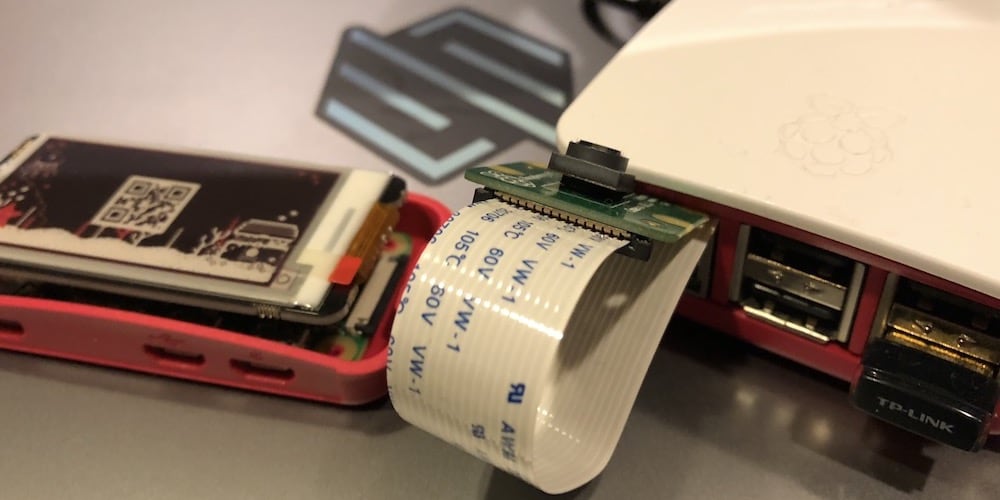
The first step required determining the best approach to retrofitting the legacy infrastructure. We were able to use digital sensors to determine when to monitor the infrastructure, but the status of the infrastructure was only available through analog gauges. We decided that we would need to take pictures of the gauges and send them off to a server which could make sense of them. So, we needed a small, low-power computer which could monitor digital sensors, trigger the capture of a picture, and then transmit that picture to a remote server. The perfect device for prototype this type of thing was a Raspberry Pi.
Raspberry Pi Anyone?
We grabbed a stock Raspberry Pi, added a sensor hat and camera, and started writing prototype firmware. To ensure that the solution was robust, we split our firmware into two distinct modules. The first module was responsible for monitoring the sensor array and triggering the camera. The second module was responsible for sending the sensor data and images off to the remote server. Because connectivity could be an issue, the communication module was built to retry; it would adjust how often it retries based upon the reliability of the connection.
Next, we needed a server to receive the data and images. Creating servers to capture data and file uploads is, from an engineering perspective, very straight forward. It is a well understood domain with many open-source options. After implementing basic authentication and authorization, we turned to the most challenging part of this portion.
We needed to pass the images along to another server which specializes in computer vision and then add the results of the vision analysis back to the rest of the sensor data. We set up a simple message queue to ensure that data would not get lost if the computer vision server ever got too busy to respond in a timely manner.
Microsoft Azure Computer Vision Pipeline
There are a few techniques for implementing a computer vision pipeline. Our first thought was to create a Python based Docker image containing OpenCV and an API server. The Docker container could be deployed and scaled on a number of different hosting platforms. We have experience creating these types of servers, but we found that Microsoft Azure had an experimental custom vision service which provided all of the infrastructure we needed.
There are other choices for these types of analytical services. Google and Amazon, as well as a few smaller firms, offer similar services. For the needs of this project, the services provided by Microsoft Azure proved to be the easiest and most reliable. So, at least as a first pass to prove the concept, Microsoft’s computer vision services were used.
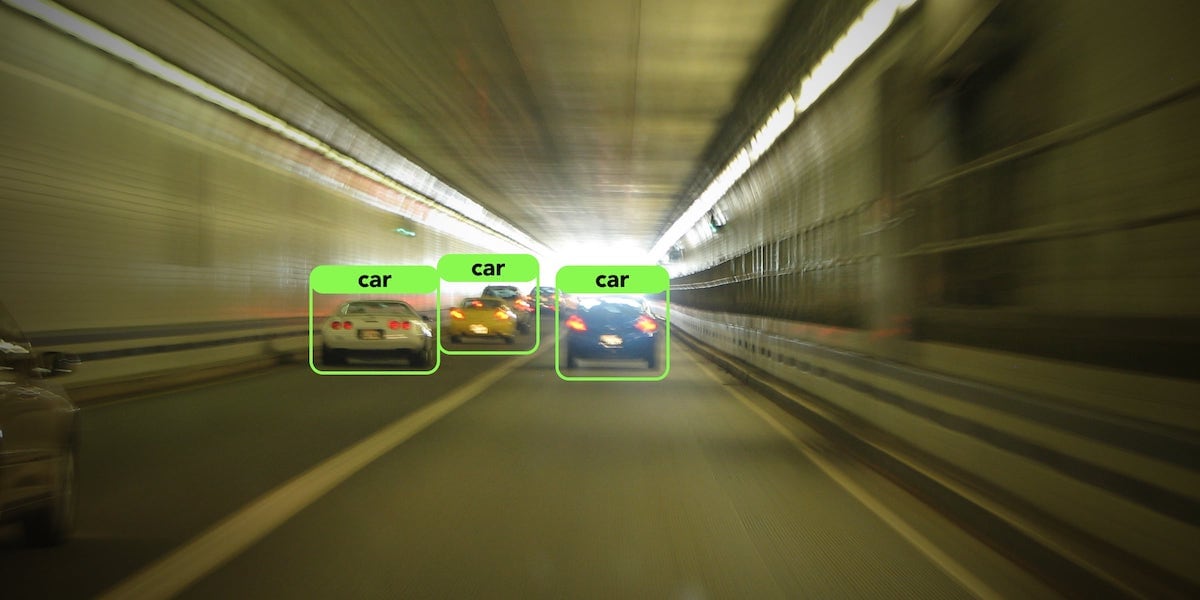
For the project needs, computer vision was not a simple plug-and-play situation. Since we could never guarantee the exactly placement of any given camera, we needed to train a computer vision algorithm which could locate the gauges we were interested in. With a relatively few example images, we were able to identify the appropriate gauges with a very high precision. The gauges are then extracted from the larger image and sent on for further processing.
Computer Vision Accuracy and Probability
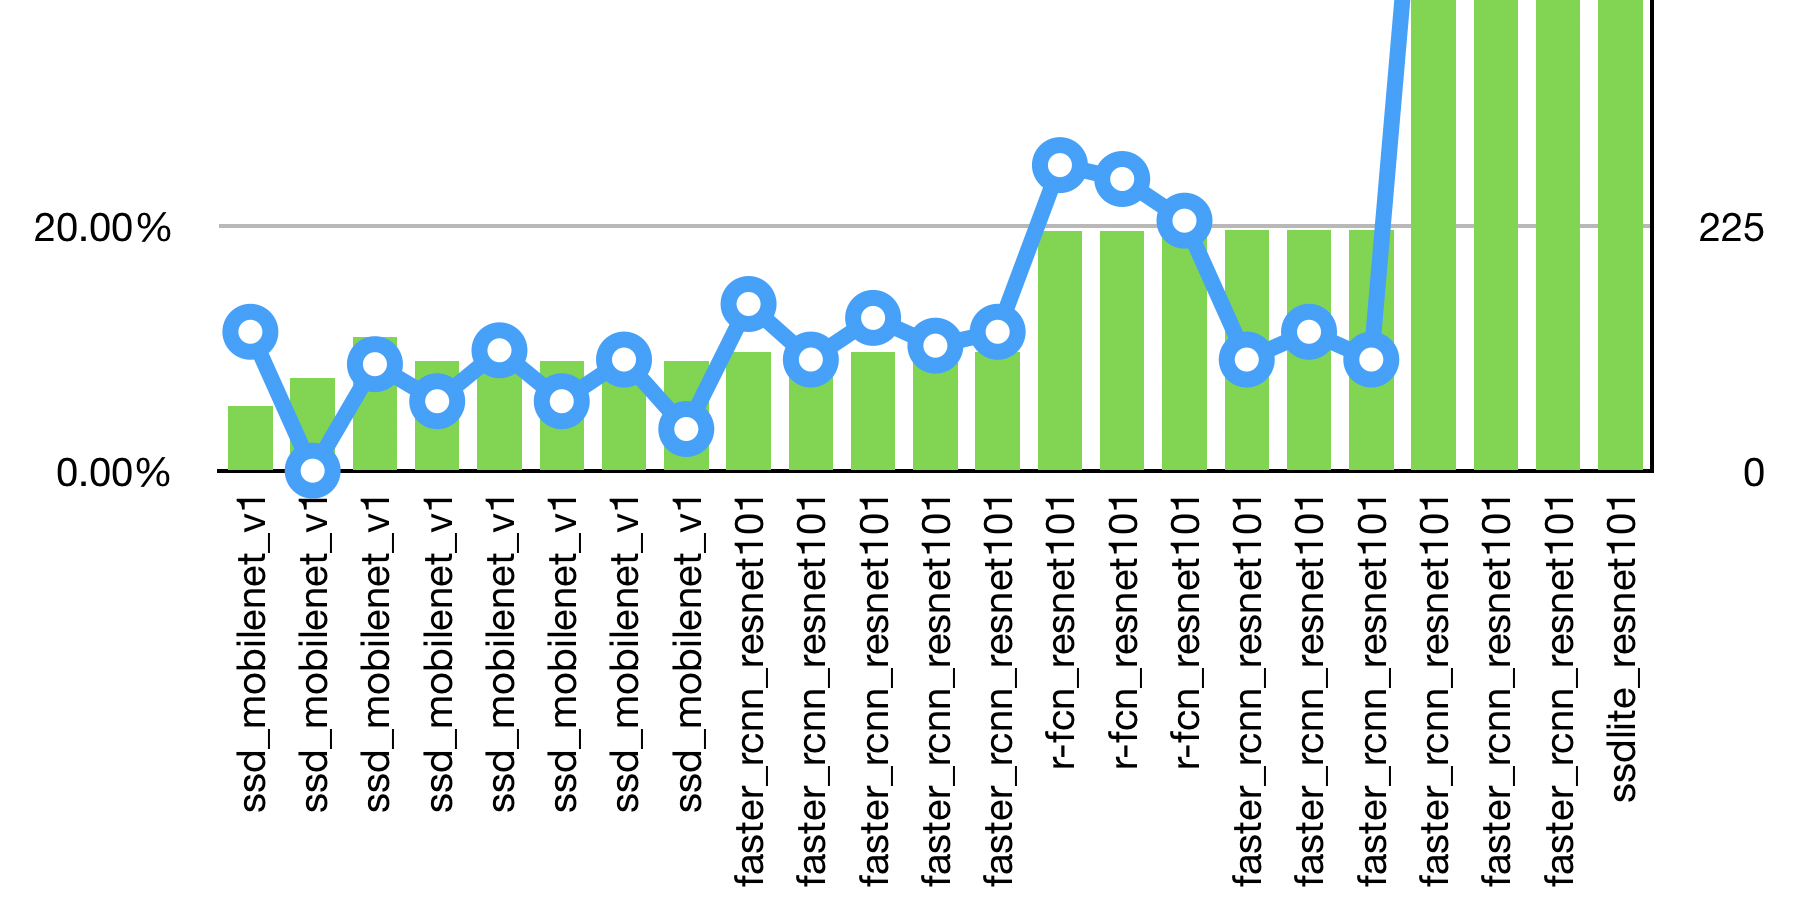
A second computer vision algorithm was trained to identify the status of the gauge. Based upon the orientation of the needle we could determine the status of the gauge. There is one small problem with analog gauges however. There are an infinite number of possible needle orientations, but we need to know specific, discrete statuses. After teaching the algorithm about the meaning of various needle positions, we tested it for precision. Unfortunately, it was not as accurate as our first algorithm. However, when we dug deeper we found that the lack of precision largely came from when the needle was near a boundary between two statuses.
We could simply assume that if the needle is so close to a boundary it could go either way. But, we wanted to see if we could improve the accuracy. The computer vision algorithm gives us a probability score for all the tags an image could possibly match. If the top probability score is below our preset threshold, then we can consider the two highest probability scores to more accurately determine if we are in fact at the boundary between two statuses.
Having determined the status of a gauge we needed to add that information back in with the rest of the data which was originally received from the sensors. The API server receives the results of the image processing pipeline and then adds that information back to the original record.
Best place to start is a proof of concept
Finally, an interface was needed for end users to see the results of the uploads and computer vision processes. Since this is a proof of concept, the most expedient way to get results back to the end-user is by accessing the same API server which is used by IOT device and the image processing pipeline. In the long-run, it may make sense to create a separate server dedicated to serving data to clients. That way we could scale the data collection end-points independently of the user interface endpoints.
For most applications there are more reads than writes, but we are expecting that there will be more writes than reads in this application. The API server provides basic alerting to reduce the need to manually check the infrastructures’ status. In the long-term, we will want to pipe all of this data into another machine learning pipeline, one which can learn about and alert on more complicated criteria. So, we expect we will not need to be manually checking device statuses on a regular basis.
There is still a lot of work to be done on this project, and each of these individual components will grow in complexity. But, we have created a modular foundation upon which we can expand and scale the project. By taking this modular approach of proving out complicated solutions, we reduce risk of the project. In the worst case, we would have quickly identified a fundamental flaw in the project hypothesis and allowed the project to fail fast with minimal investment.
In this case, we proved the viability of the project’s hypothesis and have a roadmap for bringing the project to fruition. This entire process of creating prototype hardware complete with firmware, API server infrastructure, basic notification services, a computer vision pipeline, and a small user interface, took about six weeks. Our ability to minimize development time and maximize results are one of the many reasons there is a high demand for our services from some of the worlds largest companies.
Originally published on the Skiplist blog:
Bringing together IoT, Computer Vision, and Machine Learning